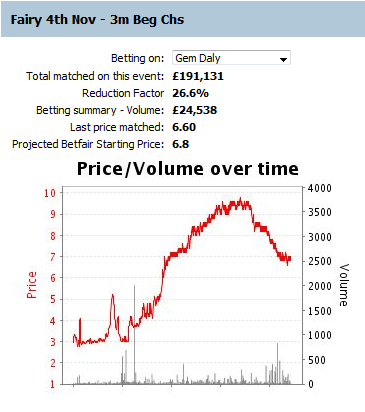
Some interesting charts
In these very dull UK markets excitement is hard to come by, but here are some interesting charts for you.
First a weird one from Fairyhouse yesterday. It’s fairly obvious that the Irish racing is quite likely to be more volatile than the UK racing, this race in particular was always going to see the odds move around a fair bit. But I didn’t expect to see what happened here.

This next chart was certainly more readable. Tons of money appeared when Northern Bolt hit it’s low price and forced the price to drift. When the drift hit it’s high price, nobody wanted to lay anymore and it came right back in again. Where Fairyhouse was a rollercoaster ride, Catterick was a gentle punt down the river, stopping off for a pint along the way. Two interesting graphs anyhow.

![]()
Category: Using Bet Angel


