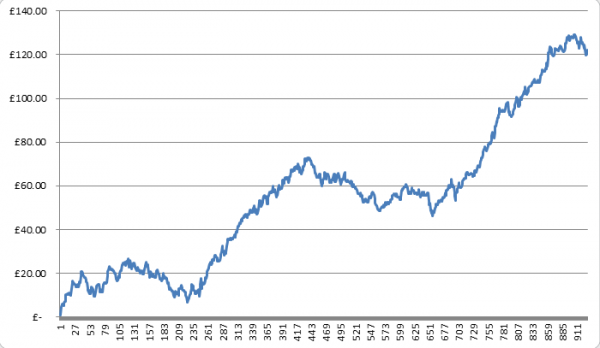
Another graph
I’m presenting another course today; if you are interested, I’ll be doing one more course on 9th December before I change the format in the new year. We still have a few places left on that one.
Amongst many things I’ll discuss and explain, I’ll be talking about this graph today. It’s curious how different strategies can throw out similar graphs. If you have seen some recent graphs I posted up you will spot the similarity, but the strategy is completely different. This one is a really simple trading strategy and uses just £10 stakes. It’s so simple that I think people could easily overlook it. So I’m going to use it as an example today of not only how simple some strategies can be, but also how peoples desire to complicate things can send them down the wrong path.
One trait I often see, is that people add layer upon layer of complexity to set up a position and all it does is either end up confusing them, or limit the opportunity so much that it doesn’t happen often. If it does the results turn out to be highly variable because the frequency of trades are so few.
Simplicity is definitely an underrated skill but also one of the tricks is putting the right strategy into the right market. A strategy doesn’t have to be complex or confusing if you deploy it in roughly in the right place. Roughly being the operative word here, as you can’t get it right all the time; you just need to ensure you get it right most of the time. When you are wrong its so tempting to trade out of your mistake, but often it makes sense to not do so, but that can be hard.
But, of course, there is a balance. People often ask me for a really simple strategy that generally works, but that’s probably the hardest thing to find! It’s better to specialise in something, recognise the opportunity; then act on it decisively. But of course, sometimes its that very last bit that is the hardest thing for people to do. If you can overcome that then you are well on your way to achieving something worthwhile.
![]()
Category: Academy, Trading strategies


